Content Production Metrics Every Editor Should Track
AI has rewritten the rules for what content visibility actually means.

U.S. organic search traffic dropped 2.5% year-over-year as of January 2026. That single number should worry any editor staring at a dashboard full of green arrows, because it hides more than it shows, and the parts it leaves out change how the drop should get read.
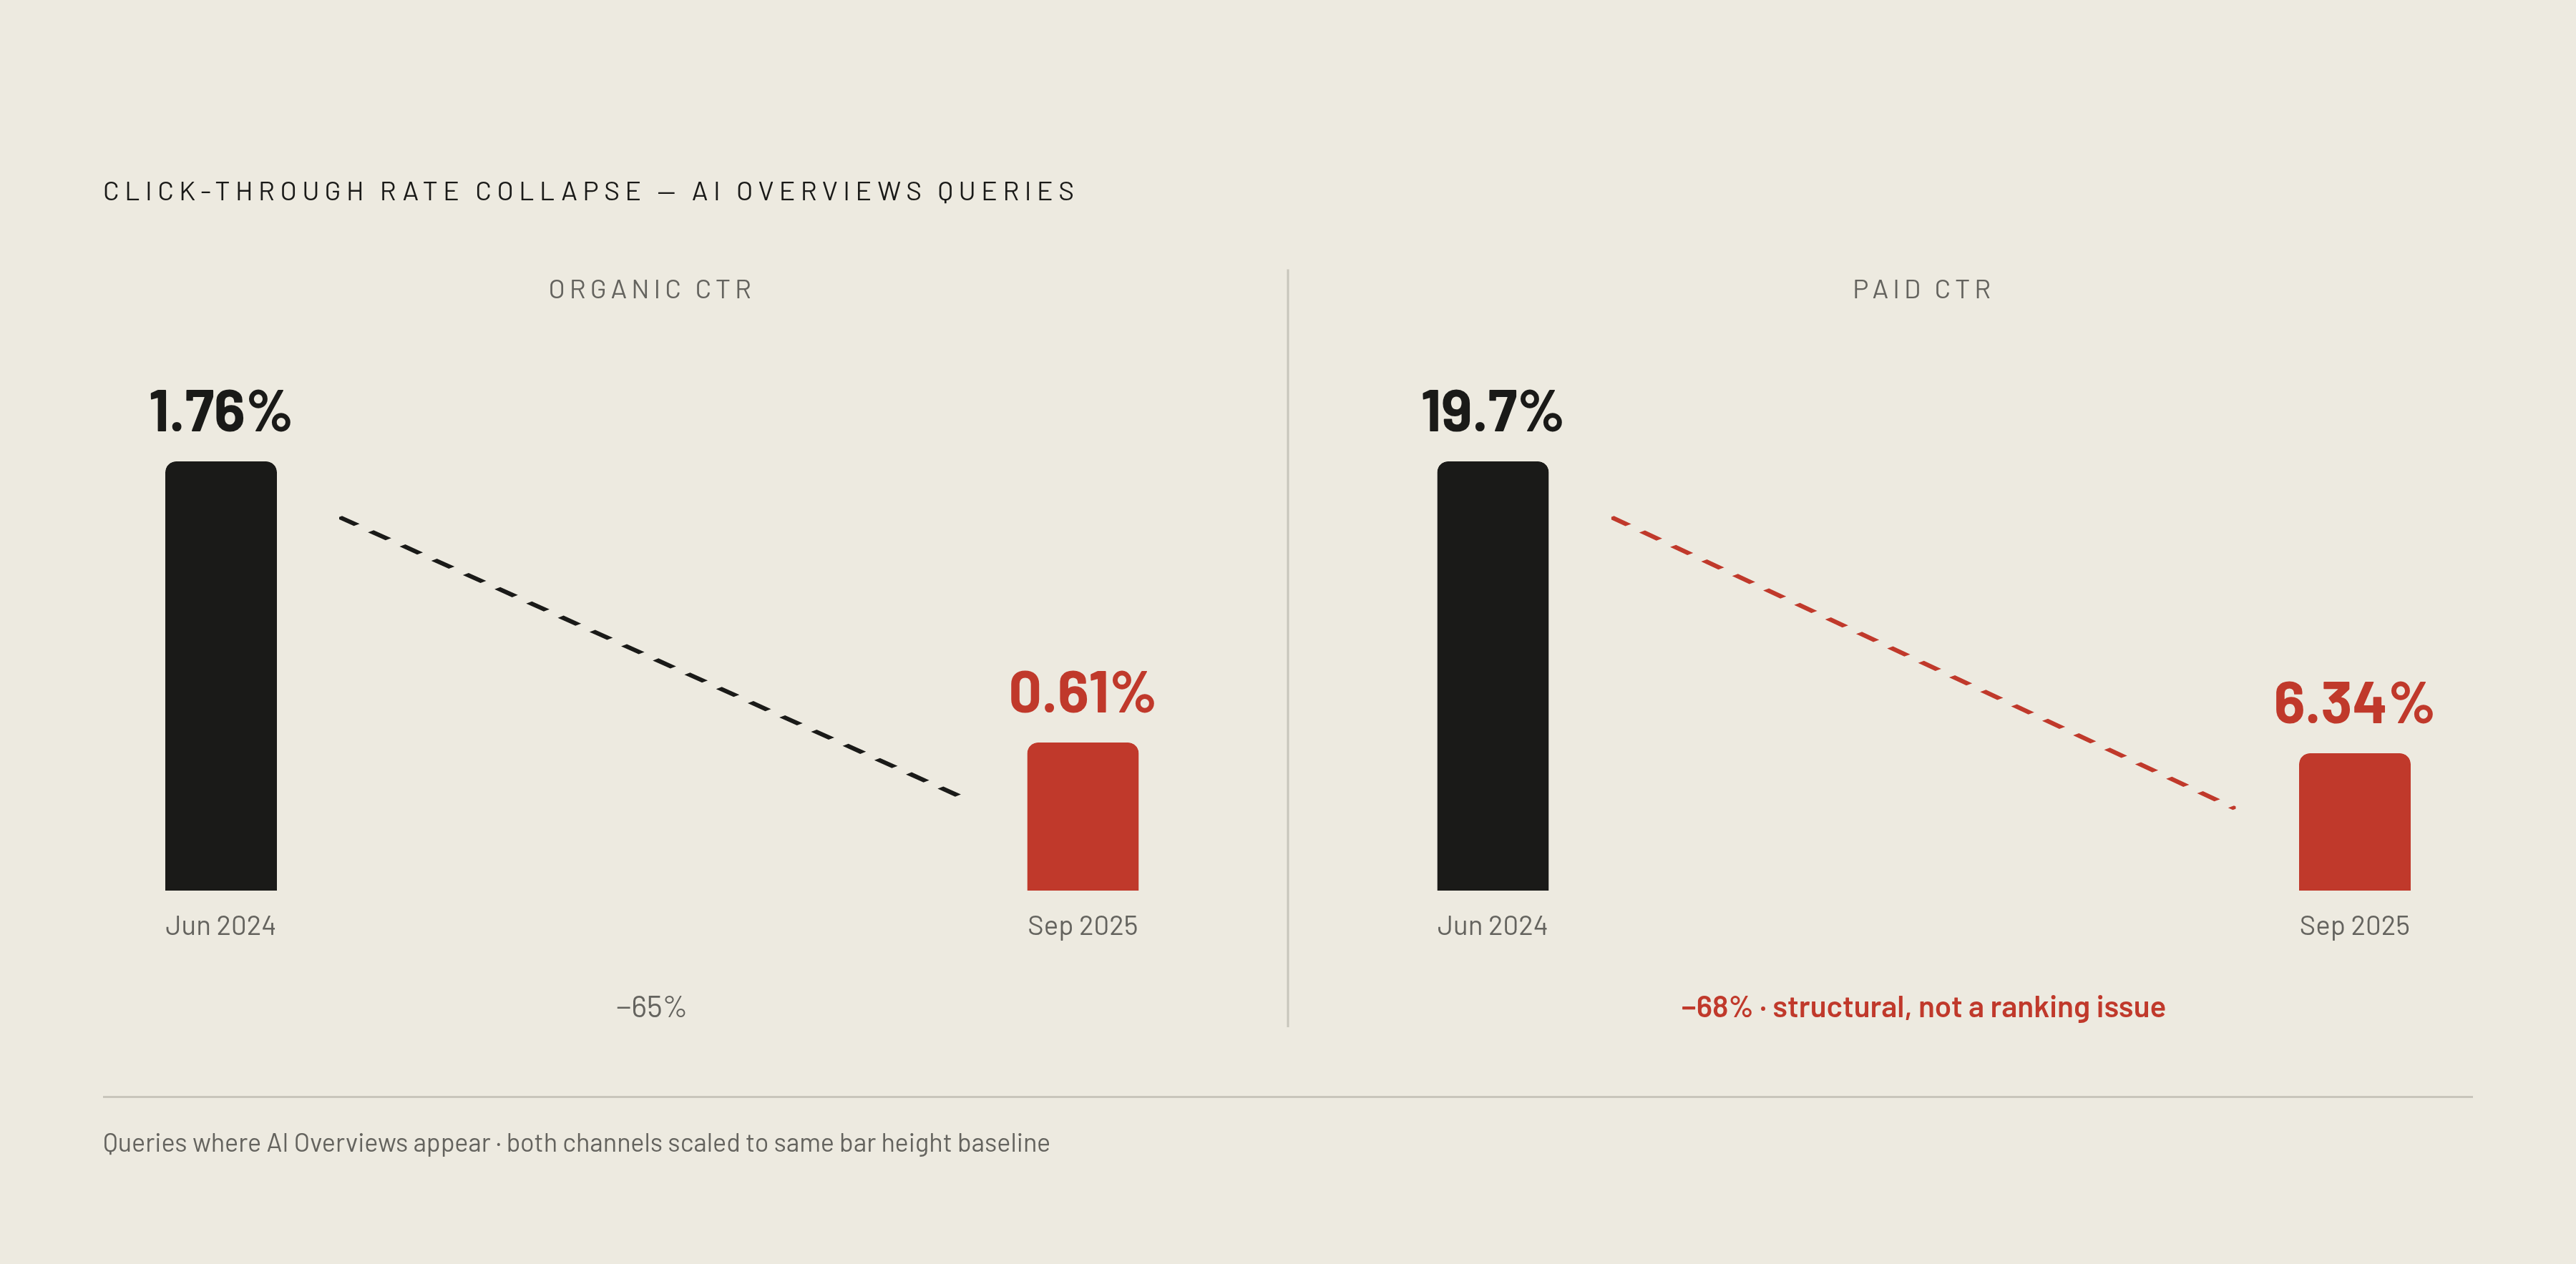
Organic click-through rate on queries where AI Overviews appear fell from 1.76% to 0.61% between June 2024 and September 2025, a drop of 65%. Paid CTR on those same queries fell even further, from 19.7% down to 6.34%, a 68% decline. That second number is the one that should stop an editor cold. Advertisers pay directly for placement and optimize obsessively for clicks, and even they're losing ground faster than organic search is. That's a structural change in how people get answers, not a ranking problem, and treating it as anything smaller is the mistake most newsrooms are still making.
Roughly 60% of all searches globally now end without a click. On mobile, that figure climbs to 77%. AI Overviews trigger on about 48% of all tracked queries according to BrightEdge, up from 30% a year earlier. Median publisher traffic is down 10% year-over-year, and the categories bleeding fastest are the same ones where AI Overview growth has been steepest; those categories are real estate, restaurants, and retail.
None of this means content stopped working. It means the dashboard stopped measuring the part of the funnel where content actually does its job now. An editor tracking sessions, pageviews, time-on-page, and keyword rank is watching what happens after the audience has already been filtered, and the filter is increasingly an AI model deciding what to quote and what to leave out. Content can get cited, trusted, and used to shape a purchase decision without ever producing a click. Google Analytics catches almost none of that by default.
How AI engines actually decide what to surface, and the resulting shift in what content needs to do
Search engines used to hand back a ranked list. AI engines do something closer to retrieval and synthesis: pull a handful of documents in response to a query, then generate an answer drawing from those sources, sometimes quoting directly, sometimes blending two or three at once. That's Retrieval-Augmented Generation, RAG for short, and it changes the competitive math. Google's results page has room for ten blue links. An LLM response typically cites somewhere between two and seven domains. The pool of winners is smaller, and getting into it runs on different rules than getting onto page one of Google.
That split appears directly in the citation data. Only 17% of AI Overview citations come from pages that also rank in the organic top 10. Ranking well and getting cited are, for the most part, two separate outcomes governed by different logic, and most editorial teams are still optimizing for the wrong one.
They're also less stable than editors are used to. On January 27, 2026, Google swapped the model behind AI Overviews to Gemini 3, and roughly 42% of the domains that had been getting cited got replaced overnight. Overlap between top-10 organic rank and AI Overview citation, something like 76% under the old model, has collapsed to somewhere between 17% and 38% depending on the dataset. Keyword rank used to drift slowly, over months. AI citation has no equivalent floor: it can flip because of a model swap nobody at the publication had any warning about.
So what actually earns the citation? Research into AI citation patterns points to semantic clarity, structured data, and classic E-E-A-T signals: transparent author bios, citations to reputable sources, a visible history of updates. Question-led content with clearly defined answer blocks beats prose that meanders toward a point. Princeton's GEO research put numbers on this, showing that the strongest optimization methods meaningfully outperformed unoptimized baselines across multiple retrieval and impression metrics. Keyword stuffing, notably, did not perform as well as content structured for clarity and retrieval. Editors chasing keyword density are working against the exact thing they're trying to win.
The production metrics that remain load-bearing (and what they should be telling you)
None of the old metrics are worthless. They're incomplete, and that gap changes how they should get used.
Publishing velocity still counts, because AI engines weight recency when choosing what to cite. A guide from 2024 with no updates since will lose ground to a thinner, fresher piece published in 2026 on the same topic, per Search Engine Land's coverage of the shift. Time-on-page and scroll depth still say something real about content quality, but only for the shrinking share of readers who click through at all, which is exactly the population an AI Overview exists to shrink further.
Keyword rankings hold up fine for navigational and transactional searches, where someone wants a specific page, a specific product, a specific login screen. They're shakier for informational queries, the category where AI Overviews now show up on roughly half of tracked searches. Core Web Vitals do double duty here. They're still a user-experience signal, but they're also a crawlability proxy: a slow-loading page risks getting skipped by an AI crawler entirely, which shrinks how much of a site is even eligible for retrieval.
Schema coverage and rich-result win rate probably already are somewhere in an editorial dashboard, filed under SEO. They deserve a promotion. Schema type coverage, rich-result win rate, and anchor stability (how often heading IDs change month to month) form the layer that makes a page parsable by an AI system in the first place, not just a Google feature.
The real question for an editor is simpler than any of the individual metrics: how much of that content has the structure an AI engine can actually pull from? Volume without that structure produces diminishing returns, and none of the metrics above will tell an editor whether their content is getting cited, characterized fairly, or converting the small number of AI-referred visitors who do click through. That needs a different layer of measurement.
The AI visibility metrics editors need to add to the dashboard
Think of this as a stack. Some of it runs on a spreadsheet and an afternoon. Some of it needs dedicated tooling, and pretending otherwise wastes a quarter.
The base layer is Citation Rate, the closest thing this field has to a consensus metric. Build a test set of queries that mirror what the target audience actually asks, then run that set through ChatGPT, Perplexity, and Google AI Overviews on a regular cadence, logging a binary yes or no on whether the brand gets cited. Track it by platform, by topic cluster, and in aggregate. Industry practice points to running a consistent set of prompts per core topic on a fixed schedule rather than as a one-off audit.
Above that sits Share of Model: how often a brand shows up in AI responses relative to named competitors. It's share of voice for the AI era, and there's no shortcut to it through organic rank data. It takes the same systematic prompt testing as citation rate, just run competitively instead of in isolation.
A third layer covers the "Big 3" KPIs across answer engine analytics tools: AI Brand Score, Visibility Score, and Average Position. Definitions shift from tool to tool, so the methodology needs checking before anyone averages numbers across platforms that aren't measuring the same thing. Position within an answer matters too. Surviving retrieval, ranking, and synthesis to land in the response a user actually reads is a stronger signal of visibility than any midstream organic ranking.
Citation Sentiment is the layer editors skip most often, and it might matter the most. Getting cited isn't the same as getting represented accurately. AI models hallucinate, they compress, and sometimes they get a brand's positioning flat wrong. Sentiment monitoring catches misrepresentation before it reaches a buyer. GEO frameworks generally target 90% or higher favorable sentiment across citations, and anything below that is a fire to put out, not a number to watch.
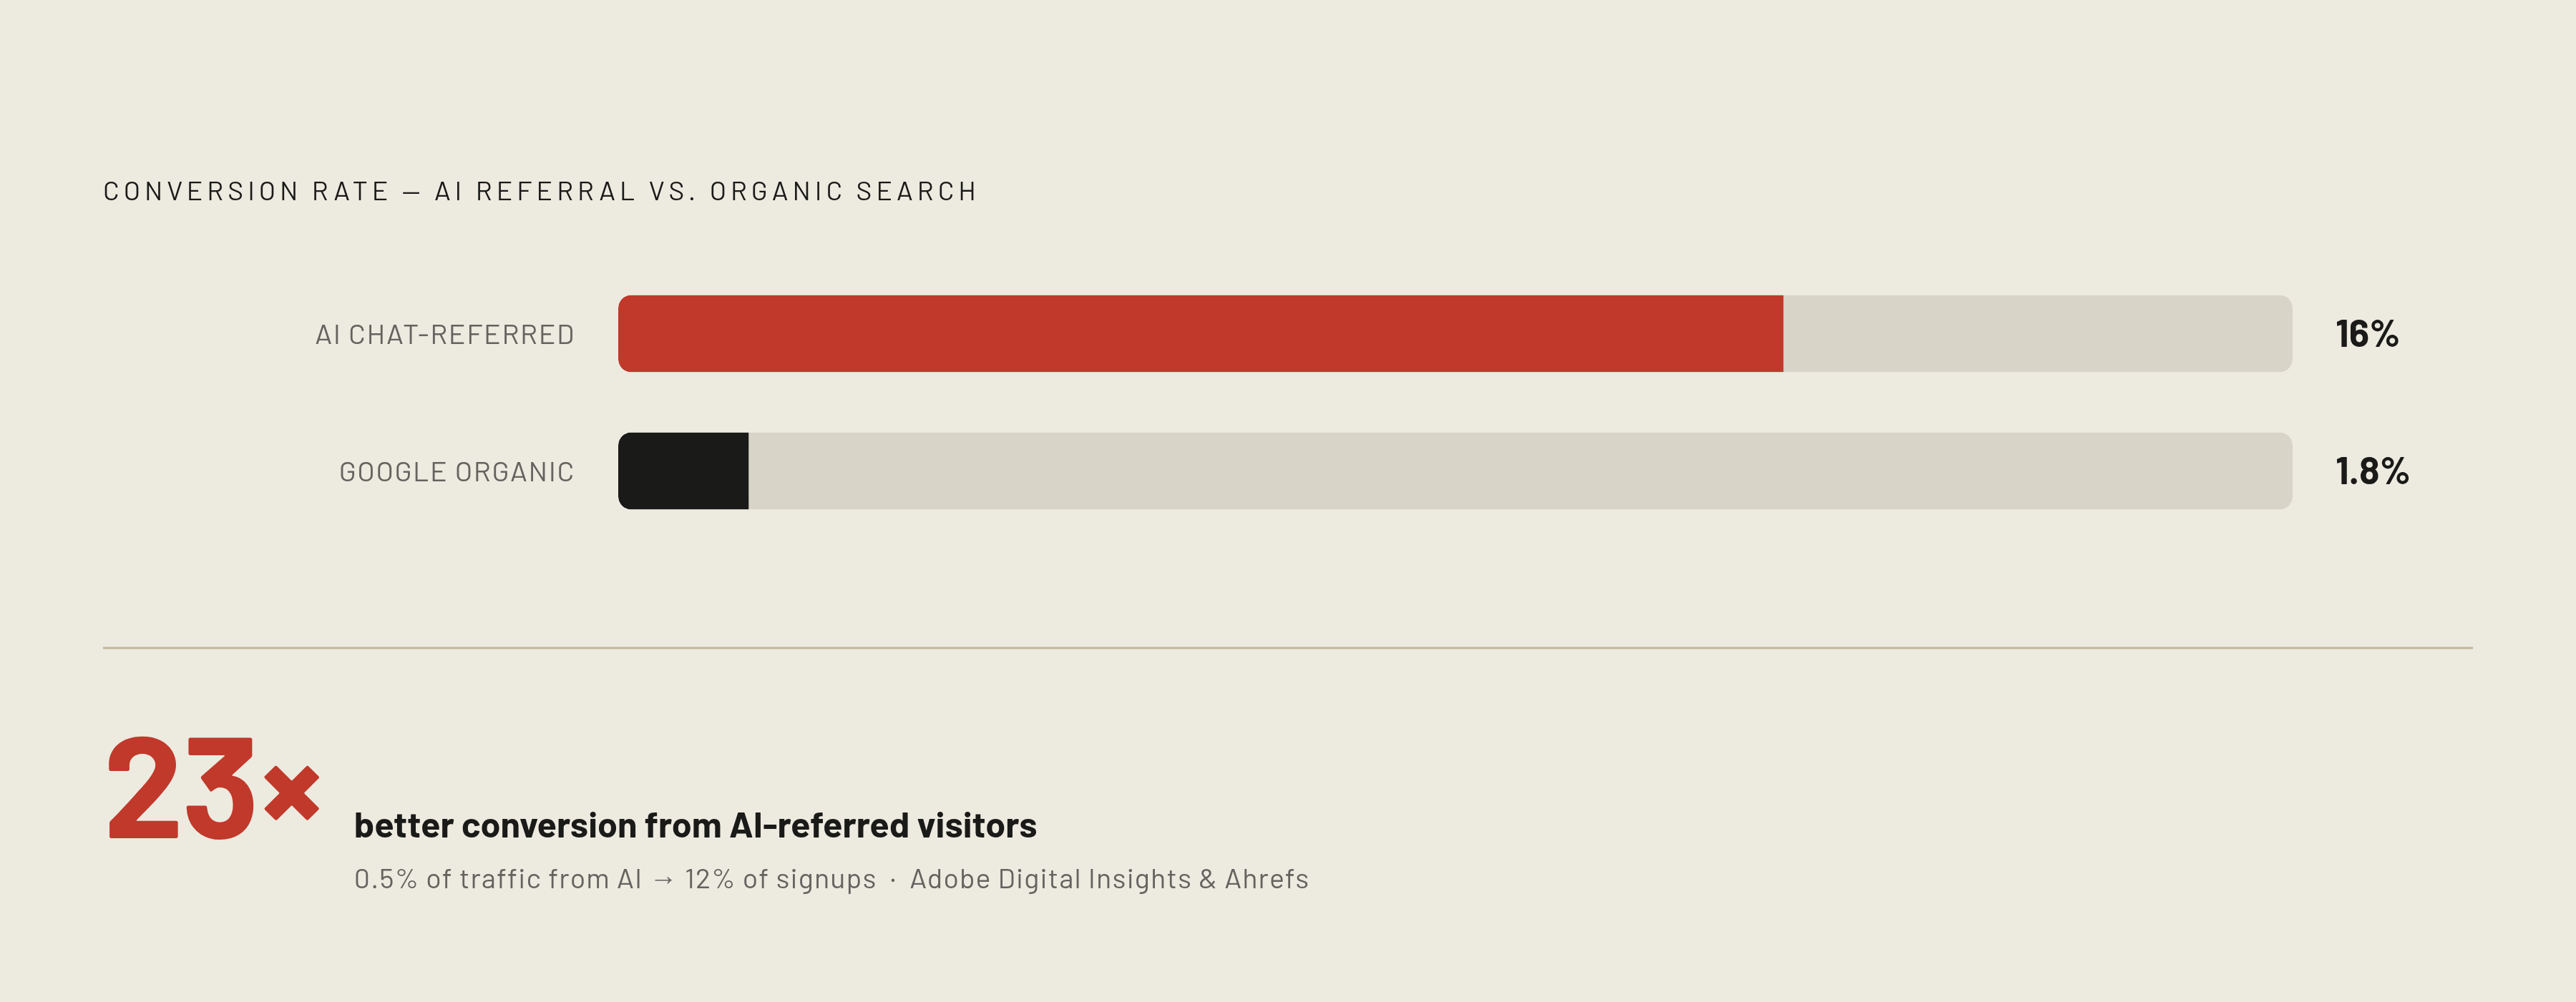
Then there's AI Referral Traffic and Conversion, tracked through GA4 attribution from sources like perplexity.ai, chat.openai.com, bing.com/chat, and gemini.google.com. This is where the numbers get genuinely strange. One research firm found traffic referred from an AI chat assistant converting at 16%, against 1.8% for Google organic. Adobe Digital Insights found AI-referred visitors convert 23 times better than traditional search traffic, even though AI search still accounts for less than 1% of total web traffic industry-wide. Ahrefs documented a site where 0.5% of traffic, coming from AI search, drove 12% of signups. A site with flat or falling sessions but rising AI-referred conversions is doing better than its own dashboard says, and that gap is what legacy reporting misses.
Last: source fragmentation. ChatGPT's share of AI referral traffic dropped from 89% to 63%, while Claude climbed to 18.5% of AI referral traffic. Tracking one chatbot alone now systematically undercounts how much traffic a site actually gets from these tools. Multi-engine tracking stopped being optional the day that shift happened.
The structural characteristics of cited content, and how editors can audit for it
AI engines don't judge a page as a whole. They break it into passages and score each one on relevance, clarity, and how much verifiable fact it packs in. A long article can have one section that gets quoted constantly and three others that never appear anywhere, because each section stands or falls on its own.
A direct-answer opener or a short summary block at the top of a section gives an AI system something clean to lift. A clean H2/H3 hierarchy signals what each passage is actually about, which shapes whether the system can extract it correctly. FAQ sections formatted as literal question-and-answer pairs get used heavily in AI-generated responses, likely because the format already matches the shape of the answer being built. Author bios, inline citations to credible sources, and a visible last-updated date all feed the E-E-A-T signals both search engines and AI models weigh.
Schema markup, specifically Article, Organization, FAQ, HowTo, and Breadcrumb types, gives an AI crawler a structured map of the page instead of forcing it to guess at meaning from raw HTML. GPTBot, ClaudeBot, and PerplexityBot all need explicit allowances in robots.txt, and a blanket disallow rule written years ago for some unrelated reason can quietly wall a site off from citation without anyone noticing until traffic drops.
Recency plays a bigger role in retrieval than most editors assume. A cornerstone piece with no visible update date loses ground to a thinner, newer treatment of the same subject for one reason: freshness is a factor in what gets pulled, regardless of depth.
Princeton's GEO research backs this at the sentence level. Two of the strongest-performing methods were labeled Statistics Addition and Quotation Addition, meaning content that cites data and names its sources beats content that just asserts things. The audit checklist that follows is short: schema coverage by type, the ratio of question-led headings to total headings, whether answer-block formatting exists at all, a crawlability check against the named AI bots, and the date of the last real content update.
None of this is a technical SEO task to hand off to a developer. These are writing and structure decisions, made at the commissioning stage and the editing desk, and treating them as IT's problem is how they get ignored.
The split outcome hiding inside the AI traffic numbers (what it means for how editors prioritize content types)
The traffic data has a wrinkle that doesn't fit the doom narrative cleanly. Brands cited inside an AI Overview earn 35% more organic clicks and 91% more paid clicks than non-cited brands on that same results page, per Seer Interactive. Branded queries that trigger an AI Overview can see meaningful increases in click-through rate. AI Overviews aren't destroying clicks so much as redistributing them, and cited brands are the ones picking up the difference.
The losses concentrate somewhere specific, hitting informational queries, the how-to's, the explainers, and the "what is" searches. Navigational and transactional queries stay largely intact. High-stakes, question-led categories carry the most exposure. SE Ranking found 44.1% of medical YMYL queries triggering an AI Overview, which puts an entire content category under pressure at once.
That should reshuffle how content investment gets prioritized, and most newsrooms haven't made the change yet. Informational content that used to earn its keep through direct traffic now earns it, if it earns anything, as citation bait, and its return should get measured through citation rate and assisted conversion rather than sessions. Deep, well-structured, regularly updated cornerstone pieces build citation authority that compounds. Thin content churned out to hit a keyword target does worse in AI retrieval, and often worse in citation rate too, since there's less for a model to extract and quote. More than 71% of Americans already use AI search to research a purchase or size up a brand before buying, the baseline to plan around now, not later. That's the baseline to plan around now, not later.
Reporting and tooling considerations for agencies tracking these metrics across a client portfolio
Running this for one brand is manageable with a spreadsheet. Running it across a client portfolio is a different problem entirely, because citation rate, share of model, and sentiment all need tracking per client, per platform, per topic cluster, and that multiplies fast once a roster hits a dozen accounts.
Traditional SEO has decades of infrastructure behind it: rank trackers, attribution models, reporting templates refined over years. Answer engine optimization is a newly named discipline, and itrs old as a named discipline, and the tooling hasn't caught up to the scale it now needs to handle. Agencies can't assume an off-the-shelf GA4 dashboard covers the AI layer, because mostly it doesn't, and finding that out mid-client-review is a bad way to learn it.
A workable answer engine analytics stack needs, at minimum, citation frequency broken out by query, engine, and time period, plus competitive benchmarking, sentiment trend tracking, and content gap mapping, all tied back into traffic and conversion data. Reporting this to a client comes with its own hurdle, too: AI-referred traffic is often a small slice of total sessions even when it converts at several times the rate of organic search, and explaining why a smaller number matters more is an education problem as much as a data problem.
Bespoke, per-client reporting is a requirement at agency scale. It's the evidence that lets an account team point to which AI visibility moves actually drove a client's business outcomes, rather than gesturing at aggregate industry trends and hoping the client nods along.
Platforms like Thrad are built for that exact operational reality: a single workspace for tracking AI visibility across an entire client portfolio, analytics that roll up across all clients at once, access controls granular enough to keep each client's data separate, and billing flexible enough to match how agencies actually contract, rather than forcing every client into one package. Account teams also get direct enablement support, so they can speak to these metrics with real fluency in a client meeting instead of screen-sharing a dashboard they don't fully understand themselves.
Agencies that can report citation rate, share of model, and AI-attributed conversion alongside the traditional engagement numbers hold a materially stronger position with clients watching their traffic decline and wondering, correctly, whether anyone can tell them why.
Building the expanded metric set into editorial workflow without doubling the overhead
None of this needs to launch all at once. Sequence it.
Start with AI referral traffic in GA4. It's the lowest-lift addition, mostly a matter of setting the right source and medium filters, and it gives an immediate read on conversion quality before any heavier tooling gets built. Citation rate tracking comes next, and it works best as a recurring editorial ritual rather than a special project: the same 50 to 100 query test set, run monthly, across whichever platforms the audience actually uses. That test set becomes an asset in its own right over time, because it shows exactly which topics the brand gets trusted to answer and which ones it's invisible on.
Schema and crawlability need a one-time baseline audit, then a permanent line on the content commissioning checklist. When citation gaps occur on topics the brand has already covered, that's a signal for a structural rewrite: tighter answer-block formatting, fresher data, stronger author and sourcing signals, applied to the site's own existing page.
Sentiment monitoring belongs in the workflow as an early-warning system, not an afterthought bolted on at the end. Catching a hallucinated or mischaracterized claim early costs far less than letting it sit and compound across however many future model training cycles happen to pick it up.
The metric set to carry forward in full includes AI Citation Rate, Share of Model, AI Referral Sessions, AI-Referred Conversion Rate, Citation Sentiment, schema coverage, and Core Web Vitals, sitting alongside the production fundamentals that still do real work. Neither list replaces the other. The dashboard just finally matches how people actually find things now.