Measuring Content Performance Beyond Traffic
Four measurement layers reveal what traffic alone can't tell you about content impact.

Traffic is the metric every content team reports and the one that proves the least. This piece breaks down what actually shows whether content is working: how deeply people read it, whether it moves prospects toward a purchase, whether it keeps paying off long after publication, and how attribution models try (and partly fail) to connect the three. The goal isn't to throw out traffic reporting. It's to build four layers of measurement underneath it so traffic stops being the whole story.
Traffic has obvious appeal. It shows up in every dashboard by default, it's easy to screenshot for a slide, and a chart trending up just feels good, whether or not anything downstream changed because of it. But a blog post pulling 50,000 pageviews a month that never touches a single deal is a vanity asset. A post pulling 500 visits a month that keeps showing up in the research trail of your highest-value customers is doing actual work. Those two posts would look identical on a traffic report, and that's the whole problem.
The scale of the issue is bigger than most teams assume. Roughly 90.63% of web content gets zero organic traffic from Google, meaning that for the overwhelming majority of published pages, traffic isn't even a flawed signal, it's a null one. Vanity metrics like impressions, likes, and open rates keep the illusion running because they're easy to generate and satisfying to look at, but they rarely say anything about pipeline or revenue. Gartner has found that marketing analytics influence only about 53% of marketing decisions, which means close to half of what gets measured never actually shapes a call anyone makes. Traffic measures reach. It tells you people showed up. It says nothing about what they did once they got there, and that distinction is the spine of everything that follows.
Why measurement stays broken even when teams know traffic isn't enough
Here's the part that should worry anyone running a content team: even marketers who know traffic isn't enough still can't measure what matters instead. Research suggests only a small minority of marketers can accurately tie content to revenue. That's not a writing problem or a topic-selection problem. It's a plumbing problem, an infrastructure gap between what content does and what systems are built to record.
The numbers stack up from there. Only about a third of marketers say they can accurately measure content ROI, which means the majority are greenlighting budget mostly on instinct and hope. Attribution ranks as the top measurement challenge for 56% of B2B marketers, and in the Content Marketing Institute's 2026 B2B report, 33% named measuring content effectiveness among their top three problems. Ask why, and the answer usually traces back to the same root cause: most measurement systems were built to log activity, not contribution. They're great at telling you what happened (traffic, engagement, leads) and nearly useless at telling you what that activity actually produced.
Nielsen has found that only 38% of global marketers evaluate ROI holistically, meaning they measure traditional and digital marketing together instead of in separate silos that never talk to each other. That silo problem shows up again at the leadership level. A CFO wants to know revenue influenced, cost per acquired customer, and pipeline contribution, because those are the numbers that justify next quarter's budget. A content manager, meanwhile, is staring at scroll depth and session counts, numbers that matter operationally but mean nothing in a budget meeting. Neither person is wrong. They just need different layers of the same signal, and most reporting setups only build one layer and hand it to everyone.
Fixing this isn't about adding more dashboards. It's about deciding, deliberately, which metrics answer which questions, and building the tracking to match. The next four sections walk through that layer by layer.
Engagement metrics that measure depth of reading, not just presence
GA4 replaced bounce rate with engagement rate, which tracks the share of sessions where a visitor stuck around at least 10 seconds, viewed two or more pages, or triggered a conversion event. For a B2B SaaS landing page built to drive demo signups, a working benchmark sits somewhere around 50 to 65%. Below that, a page might be technically "getting traffic" while doing almost nothing for anyone who lands on it.
Average engagement time adds texture to that number. Contentsquare's 2024 benchmark put average page engagement time at 52 seconds across industries, so anything meaningfully above that, for a given content type, suggests people are actually reading rather than bouncing off a headline. The pattern compounds too: sites with above-average engagement time tend to see conversion rates roughly 2.3 times higher, and each extra page a visitor views correlates with about an 18% bump in session duration. Reading begets reading, apparently.
Scroll depth answers a slightly different question: not how long someone stayed, but how far they got before giving up. If most visitors stop scrolling before the 40% mark, then everything below that point, including the call-to-action a marketer spent a week arguing about, is functionally invisible. Benchmarks vary a lot by site type. E-commerce runs 45 to 55%, blog and content sites run higher at 60 to 70%, news and media sit at 40 to 50%, B2B/SaaS lands around 50 to 60%, and landing pages, built for speed rather than depth, sit lowest at 35 to 45%. Users who scroll past 75% of a product page convert at roughly 3 times the rate of those who don't, and they also stick around on the site overall about 3.4 times longer. Scroll depth, in other words, isn't a vanity number either. It's a leading indicator wearing a boring name.
There's a catch worth flagging before anyone treats GA4 scroll data as gospel. Cookie consent rejection alone wipes out somewhere between 34 and 47% of EU visitors from tracking, according to a 2024 USENIX Security study covering close to 4,000 people. Ad blockers like uBlock Origin, Ghostery, and Brave's built-in shields remove another 15 to 40% of visitors from view, and those people are scrolling the page just fine, GA4 simply never loads for them. The practical fix is to treat this data as directional rather than a full census, segment EU traffic from the rest, and watch trend lines instead of obsessing over the absolute number.
Video engagement runs on the same logic as scroll depth, just for a different medium. Around 87% of consumers say a video convinced them to buy from a brand, so video completion rate deserves the same attention text scroll depth gets, since both are measuring whether someone actually consumed the thing or just clicked past it. And zooming out, Contentsquare's Digital Experience Benchmark 2026, drawn from 99 billion sessions across more than 6,500 websites, recorded a year-over-year engagement drop of 10%. Which is a good reminder that industry benchmarks move. What matters more than beating some external number is whether a content team's own trend line is heading up or down.
Conversion metrics that connect content to pipeline, not just leads
Conversion rate is the bridge between "people read this" and "people did something because of it." It's simply the share of visitors who completed a desired action against total visitors, and the Content Marketing Institute has found that 72% of successful content marketers track specific conversion metrics to prove ROI. Nobody's cracking the code with vibes.
Platforms like Letterstory, an end-to-end content automation platform, build conversion tracking into the content lifecycle rather than leaving it as an afterthought.The benchmarks help set expectations. Blog conversion averages run 1.1 to 5.5% depending on industry, and Sumo's data puts average email signup rate from content at 2.35%. Gated content, the kind that asks for an email before handing over a whitepaper, tends to convert at noticeably higher rates than open blog content, though high-intent demo request pages operate on different logic: each conversion is worth far more in pipeline terms. A lower conversion rate on a demo page can outproduce a higher rate on a newsletter signup once deal value is factored in.
None of that matters as a business argument until a dollar figure gets attached to it. Conversion value assignment means tying a monetary number, based on average deal size or historical close rate, to specific actions: a form fill, a demo booking, a content download. That single step is what turns "conversion rate went up" from a percentage into a sentence a CFO will actually sit still for.
Content-influenced pipeline is the metric that most directly answers the budget question, because it tracks every deal content touched at any stage, not just the last click before close. Underneath it sit a few sub-metrics worth separating out: pipeline sourced versus pipeline influenced, and the overall velocity of deals where content played a role. For account-based marketing programs, where the target list is deliberately small, target account engagement matters even more, since raw traffic volume was never the goal to begin with.
Track conversion properly, and a genuinely useful comparison shows up: content marketing tends to generate roughly 3 times more leads than outbound marketing, at about 62% lower cost. That gap is invisible to anyone not tracking conversion by source. It's also where a commonly cited figure from DemandMetric, $2.80 in return for every $1 spent on content, actually becomes defensible instead of just a slide decoration. The number only means something once conversion value is assigned and tracked upstream, not tacked on afterward to make a report look better.
Retention metrics that identify which content keeps compounding after publication
The case for retention starts with a reframe: content that performs consistently over time isn't a one-time asset to be published and forgotten, it's inventory that keeps generating returns. Treated that way, it reduces the pressure to publish constantly just to keep the traffic chart from dipping.
Returning visitor ratio is the simplest gauge of whether that's happening. Are the people who found a piece of content coming back for more, or was it a one-time search click that led nowhere? A high ratio suggests an actual audience is forming, not just a pageview being harvested once and discarded.
Cohort retention analysis takes that a step further by comparing 7-day and 28-day return rates across topics or content formats. The practical goal is identifying clusters where cohort retention meaningfully exceeds baseline, since those are the topics worth doubling down on rather than spreading effort evenly across everything published. What counts as meaningful will vary by program, but any consistent outperformance is a signal worth acting on.
Consistent organic traffic after initial publication is the practical test of whether a piece is actually evergreen, as opposed to just labeled that way in a content calendar. A post that keeps pulling search traffic months or years later earned that label. One that spikes and disappears within two weeks didn't, no matter what the original brief called it.
Retention shows up at the platform level too. Contentsquare's 2026 benchmark recorded a 13% retention rate, meaning visitors returning within 30 days, which offers a useful outside reference point for teams setting their own internal targets. And retention math has real teeth attached to it: commonly cited retention research suggests that a 5% increase in customer retention can lift profits anywhere from 25% to 95%. Content that keeps existing customers informed and engaged is participating directly in that math, not sitting off to the side of it. Customers who engage with a brand across multiple channels show roughly 30% higher lifetime value than single-channel shoppers. Distribution breadth, in other words, isn't just about reach. It's about who ends up on the other end of it.
Attribution models and the signal loss every content team needs to plan around
Multi-touch attribution assigns fractional credit across every touchpoint in a customer's journey instead of handing all the credit to whichever interaction happened first or last. It exists because both of the simpler models lie in predictable directions. First-touch attribution overvalues top-of-funnel content, mostly blog posts, and undervalues the case studies and email nurtures doing the middle-of-funnel convincing. Last-touch does the opposite: it hands full credit to whatever the prospect clicked right before converting and erases every earlier interaction that actually built the intent to convert in the first place.
Even multi-touch attribution has holes no model fully patches. Apple's iOS 14.5 consent changes mean paid social channels now see something like 40 to 60% of conversions modeled rather than directly observed, and while server-side tracking recovers some of that lost signal, it doesn't recover all of it. Separately, a meaningful share of B2B buyer touchpoints happen somewhere attribution tools simply can't see: peer referrals, review sites, and conversations in channels where UTM parameters simply don't exist. Multi-touch models assign these zero credit by design, which quietly overfunds whatever channel happens to be trackable, regardless of whether it's actually doing the most work.
Dark social is the sharpest version of this blind spot. Someone forwards a case study over Slack or WhatsApp, a colleague reads it, clicks through to a demo page days later, and the analytics dashboard shows the source as "Direct," as if the person simply typed the URL from memory one afternoon. Content drove that visit. The tracking just never saw it happen, and there's no elegant fix for that inside the analytics platform itself. The workaround is blunt but effective: add a "how did you hear about us?" field to high-value forms and let buyers self-report what the tools can't see. It won't recover every dark social touchpoint, but it recovers some, and some is a lot more than zero.
Given all that, the honest operating posture for 2026 is to accept that no attribution model captures the full picture, and to aim for directional confidence and consistent trends rather than perfectly assigned credit for every dollar. Context matters here too: Contentsquare's 2026 benchmark recorded an overall conversion rate shift of negative 5.1% year-over-year across its dataset, meaning a content program holding flat conversion in a declining market might actually be outperforming, even though the number on its own looks stagnant.
Building a measurement stack that connects all four layers without requiring enterprise tooling
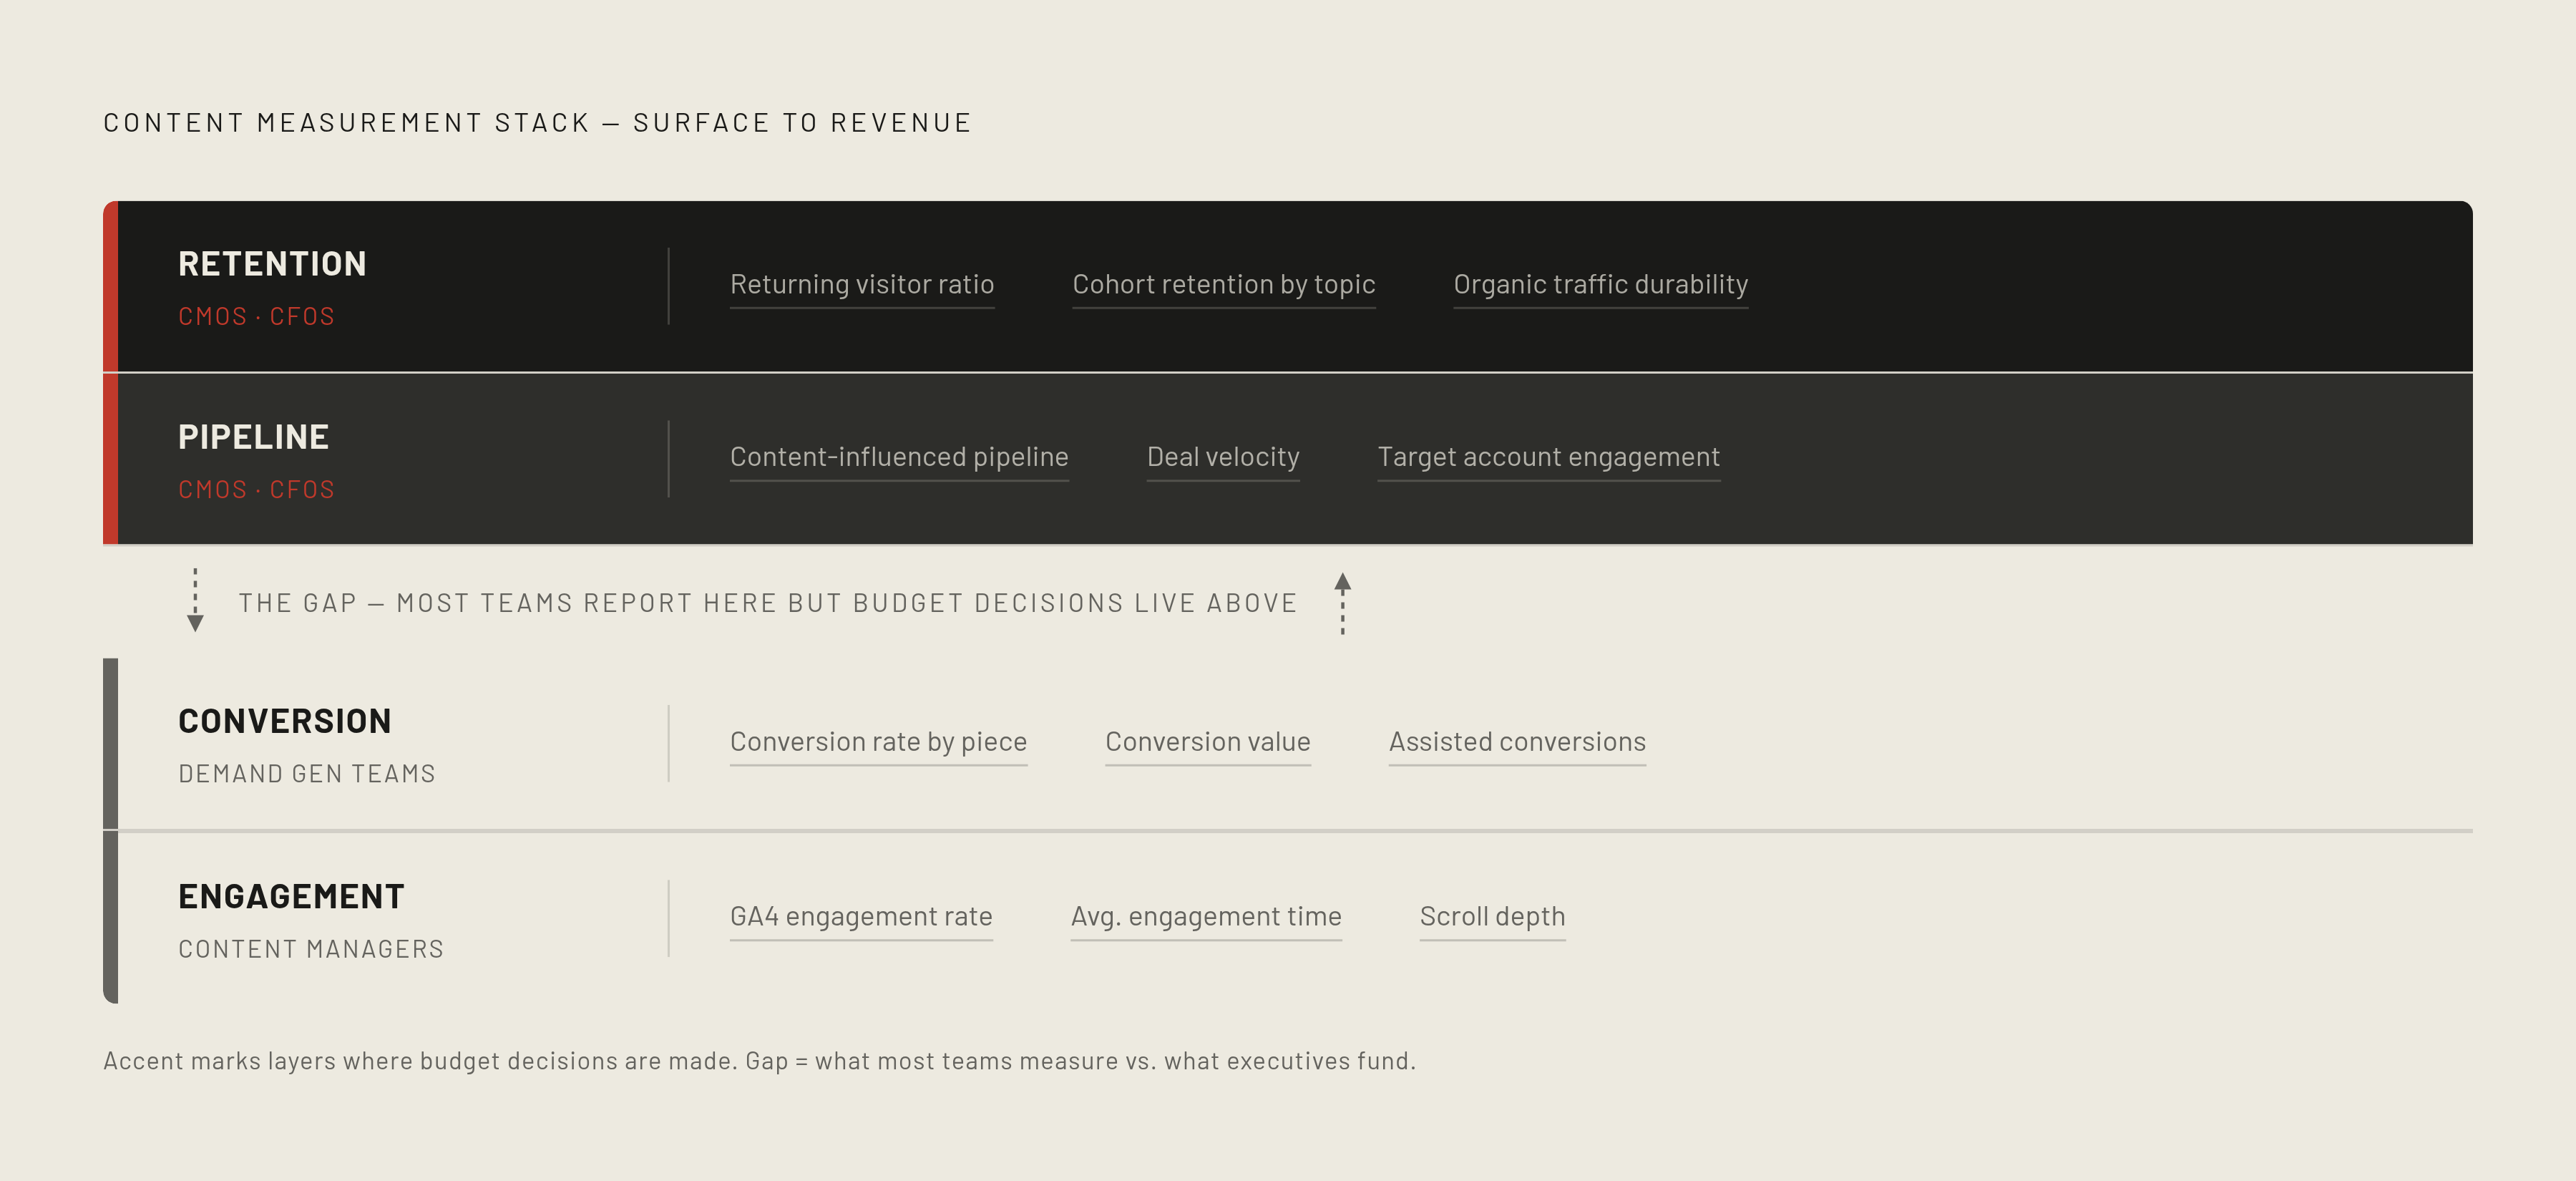
Stack the four previous sections together and a structure falls out naturally. Layer one is engagement: GA4 engagement rate, average engagement time, scroll depth. Layer two is conversion: conversion rate by piece, conversion value, assisted conversions. Layer three is pipeline: content-influenced pipeline, deal velocity, target account engagement. Layer four is retention: returning visitor ratio, cohort retention by topic cluster, organic traffic durability over time.
Matching each layer to the right audience matters as much as collecting the data in the first place. Content managers need engagement and scroll numbers to know what's actually landing. Demand gen teams need conversion and pipeline numbers to know what's moving deals. CMOs and CFOs need pipeline influence and lifetime value contribution, full stop, because that's the only layer that speaks the language a budget conversation runs on. Report scroll depth to a CFO and watch the meeting go sideways fast. Report pipeline influence to a content manager trying to fix a specific page, and it tells them nothing about what to change.
None of this requires enterprise software. A minimum viable setup runs on GA4 for engagement, scroll, and conversions, strict UTM tagging across every distribution channel, and a CRM integration that flags which pipeline is marketing-sourced versus marketing-influenced. That's mostly configuration work, not new tooling bought and bolted on. Layer in self-reported attribution on the highest-value conversion forms to catch some of the dark social traffic that analytics can't, and the stack covers most of what matters without a six-figure line item.
Cadence matters just as much as the metrics themselves, since different layers move at different speeds and reviewing them all on one calendar is a good way to miss what each one is actually telling you. Engagement metrics deserve a weekly or biweekly look, conversion and pipeline numbers make more sense monthly, and retention plus lifetime value metrics belong on a quarterly cycle, since that's roughly how long it takes those trends to become visible at all.
One shift worth naming directly: as AI-assisted content workflows compress production timelines from months down to days, the bottleneck in most content operations doesn't disappear, it just relocates. It moves from "how fast can this get published" to "how well is this getting measured." A team that publishes twice as fast but keeps measuring the old way isn't making better decisions. It's just generating more unread data, faster.
Content tracked across all four layers, tied to pipeline, and checked periodically for retention behaves like an asset: it keeps paying out long after the publish date. Content measured only by traffic behaves like an activity log. It piles up impressively. It just doesn't compound into anything.